Stratrix’s Take
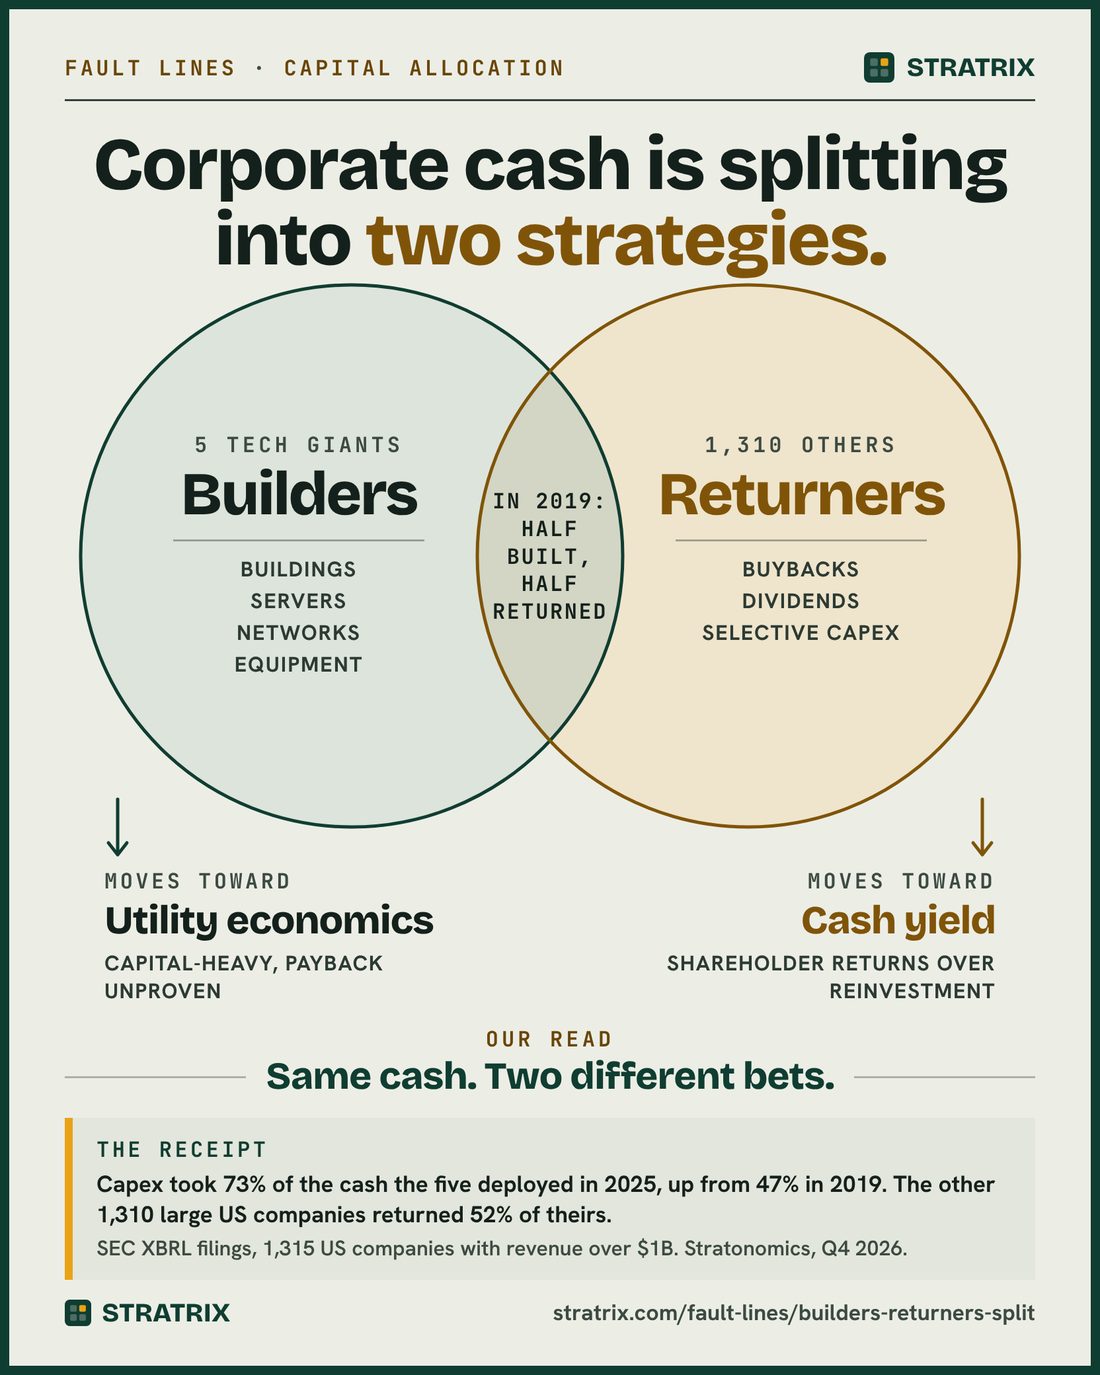
Capital allocation used to be one playbook: build some, return some. In 2019, even the five biggest spenders in tech split the cash they deployed about evenly, 47% to capex and 52% back to shareholders.
By 2025 the playbook had split in two. The five invest like utilities; almost everyone else runs as a cash machine for its shareholders. Neither camp is wrong. The risk is the company that drifted into one without choosing it, and so never priced what that camp can get wrong.
Same cash. Two different bets.
The evidence
Stratonomics read the SEC filings of 1,315 US public companies with revenue over $1 billion, from 2016 to 2025. The five are Amazon, Alphabet, Meta, Microsoft and Oracle. The chart shows capex per dollar of revenue, in cents.
The five spent 25 cents of every revenue dollar on capital assets in 2025, up from 10 cents in 2019. Utilities spent 26 cents. The other 1,310 companies spent 5 cents, against 5 cents in 2019.
Capex took 73% of the cash the five deployed (capex, acquisitions, buybacks and dividends), up from 47%. Across everyone else, the share returned to shareholders rose to 52% from 48%.
The five's capex came to $413 billion in 2025: 31% of all capex by large US public companies, against 9% in 2019.
The full data story → Stratonomics: Buybacks vs Capex, with every figure checked against the filings.
When it doesn’t hold
Everyone else is not one bloc. Utilities put 79% of the cash they deployed into capex, telecom 55% and energy 48%, while technology companies outside the five returned 66% to shareholders. Compare your company with its own industry before the average.
The five did not stop returning cash. Their buybacks and dividends came to $136 billion in 2025, against $78 billion in 2019. The split is in the mix, not a stop.
The utility comparison ends at the spending. A utility earns a return that a regulator sets on what it builds. The five earn whatever customers will pay for the capacity once it exists, and they pay for it first.
Budgets swing. The five's capex fell 7% in 2023, then rose 62% in 2024 and 73% in 2025. A camp is a position, not a permanent address.
What to do before the next capital plan
- Write down the hurdle rate that sends cash back. Returning cash is the right call for a business without projects that beat its cost of capital. Returning it by default is not. Put the hurdle in the capital plan, so the choice between building and returning is made against a number, not a habit.
- Benchmark against your own industry. With 31% of large-company capex now in five budgets, an all-company average says more about five companies than about yours. Set your capex per revenue dollar beside your own industry's.
- If you build, stage the commitment. The builder's risk is capacity paid for before anyone knows what it will earn. Stage the spend against outside evidence (an order, a contract, a paying customer) rather than against the plan.
Place your own company
The calculator is free and the result shows here; the full report (PDF, Word and Excel) comes by email. The packs below take the decision further, one for each camp.
Builder or returner? Place your company
Enter last year's figures from your cash flow statement, in millions of dollars. The comparison groups are the ones in the study.
Capex per revenue dollar, in cents: 6 · Share of deployed cash returned to shareholders: 52.9%
A comparison with groups of large US public companies, from Stratrix's reading of their SEC filings. It is not a rating or advice: where your company should sit depends on the returns its projects can earn against its cost of capital.
Results
| Value | |
|---|---|
| Capex per revenue dollar, in cents | 6 |
| Cash deployed | $170 |
| Share of deployed cash returned to shareholders | 52.9% |
| Share of deployed cash going to capex | 35.3% |
| Capex per revenue dollar against the five, in cents (above zero: more than the five) | -19 |
| Capex per revenue dollar against everyone else, in cents | 1 |
| Share returned against everyone else, in points | 0.94 |
Your inputs
| Value | |
|---|---|
| Revenue | $1,000 |
| Capital expenditures | $60 |
| Cash paid for acquisitions | $20 |
| Share buybacks | $50 |
| Dividends paid | $40 |
About the method
- The five (Amazon, Alphabet, Meta, Microsoft, Oracle) spent 25 cents of every revenue dollar on capex in 2025. Utilities spent 26 cents; the other 1,310 large companies 5 cents.
- Capex took 73% of the cash the five deployed. The other 1,310 returned 52% of theirs to shareholders.
- Cash deployed is capex plus acquisitions, buybacks and dividends, as in the study.
Get the full report: PDF report, Word (editable), Excel
Get the next Fault Line, and the rest of Stratrix's analysis, by email.
Sources
For information and strategic analysis only, not investment advice. Stratrix does not recommend buying, selling or holding any security.
Tools to try
- Ansoff move finderFramework: Ansoff Matrix
- Business model canvas builderFramework: Business Model Canvas
- Change readiness checkFramework: Kotter's 8-Step Change Model
- Five Forces scorerFramework: Porter's Five Forces
- SMART goal builderFramework: SMART Goals
- SWOT builderFramework: SWOT Analysis
More from Stratrix
Strategic Decisions
The big calls companies keep facing, told through the 819 companies on record that made them.
24 decisionsFind your decision →The Strategist’s Craft
The methods behind the job: the planning cycle, initiative charters, decision rights, the memo that gets a yes.
Methods and templatesStart with the craft →Stratrix Team
Every Casebook, three Strategy Packs a seat each year and Ask Stratrix, for teams that face these decisions all year.
$1,999 a year · $499 a seatWhat is included →New analyses, by email
The defining moves in business, and what they teach, as they publish.