Paying in shares makes a company look healthier
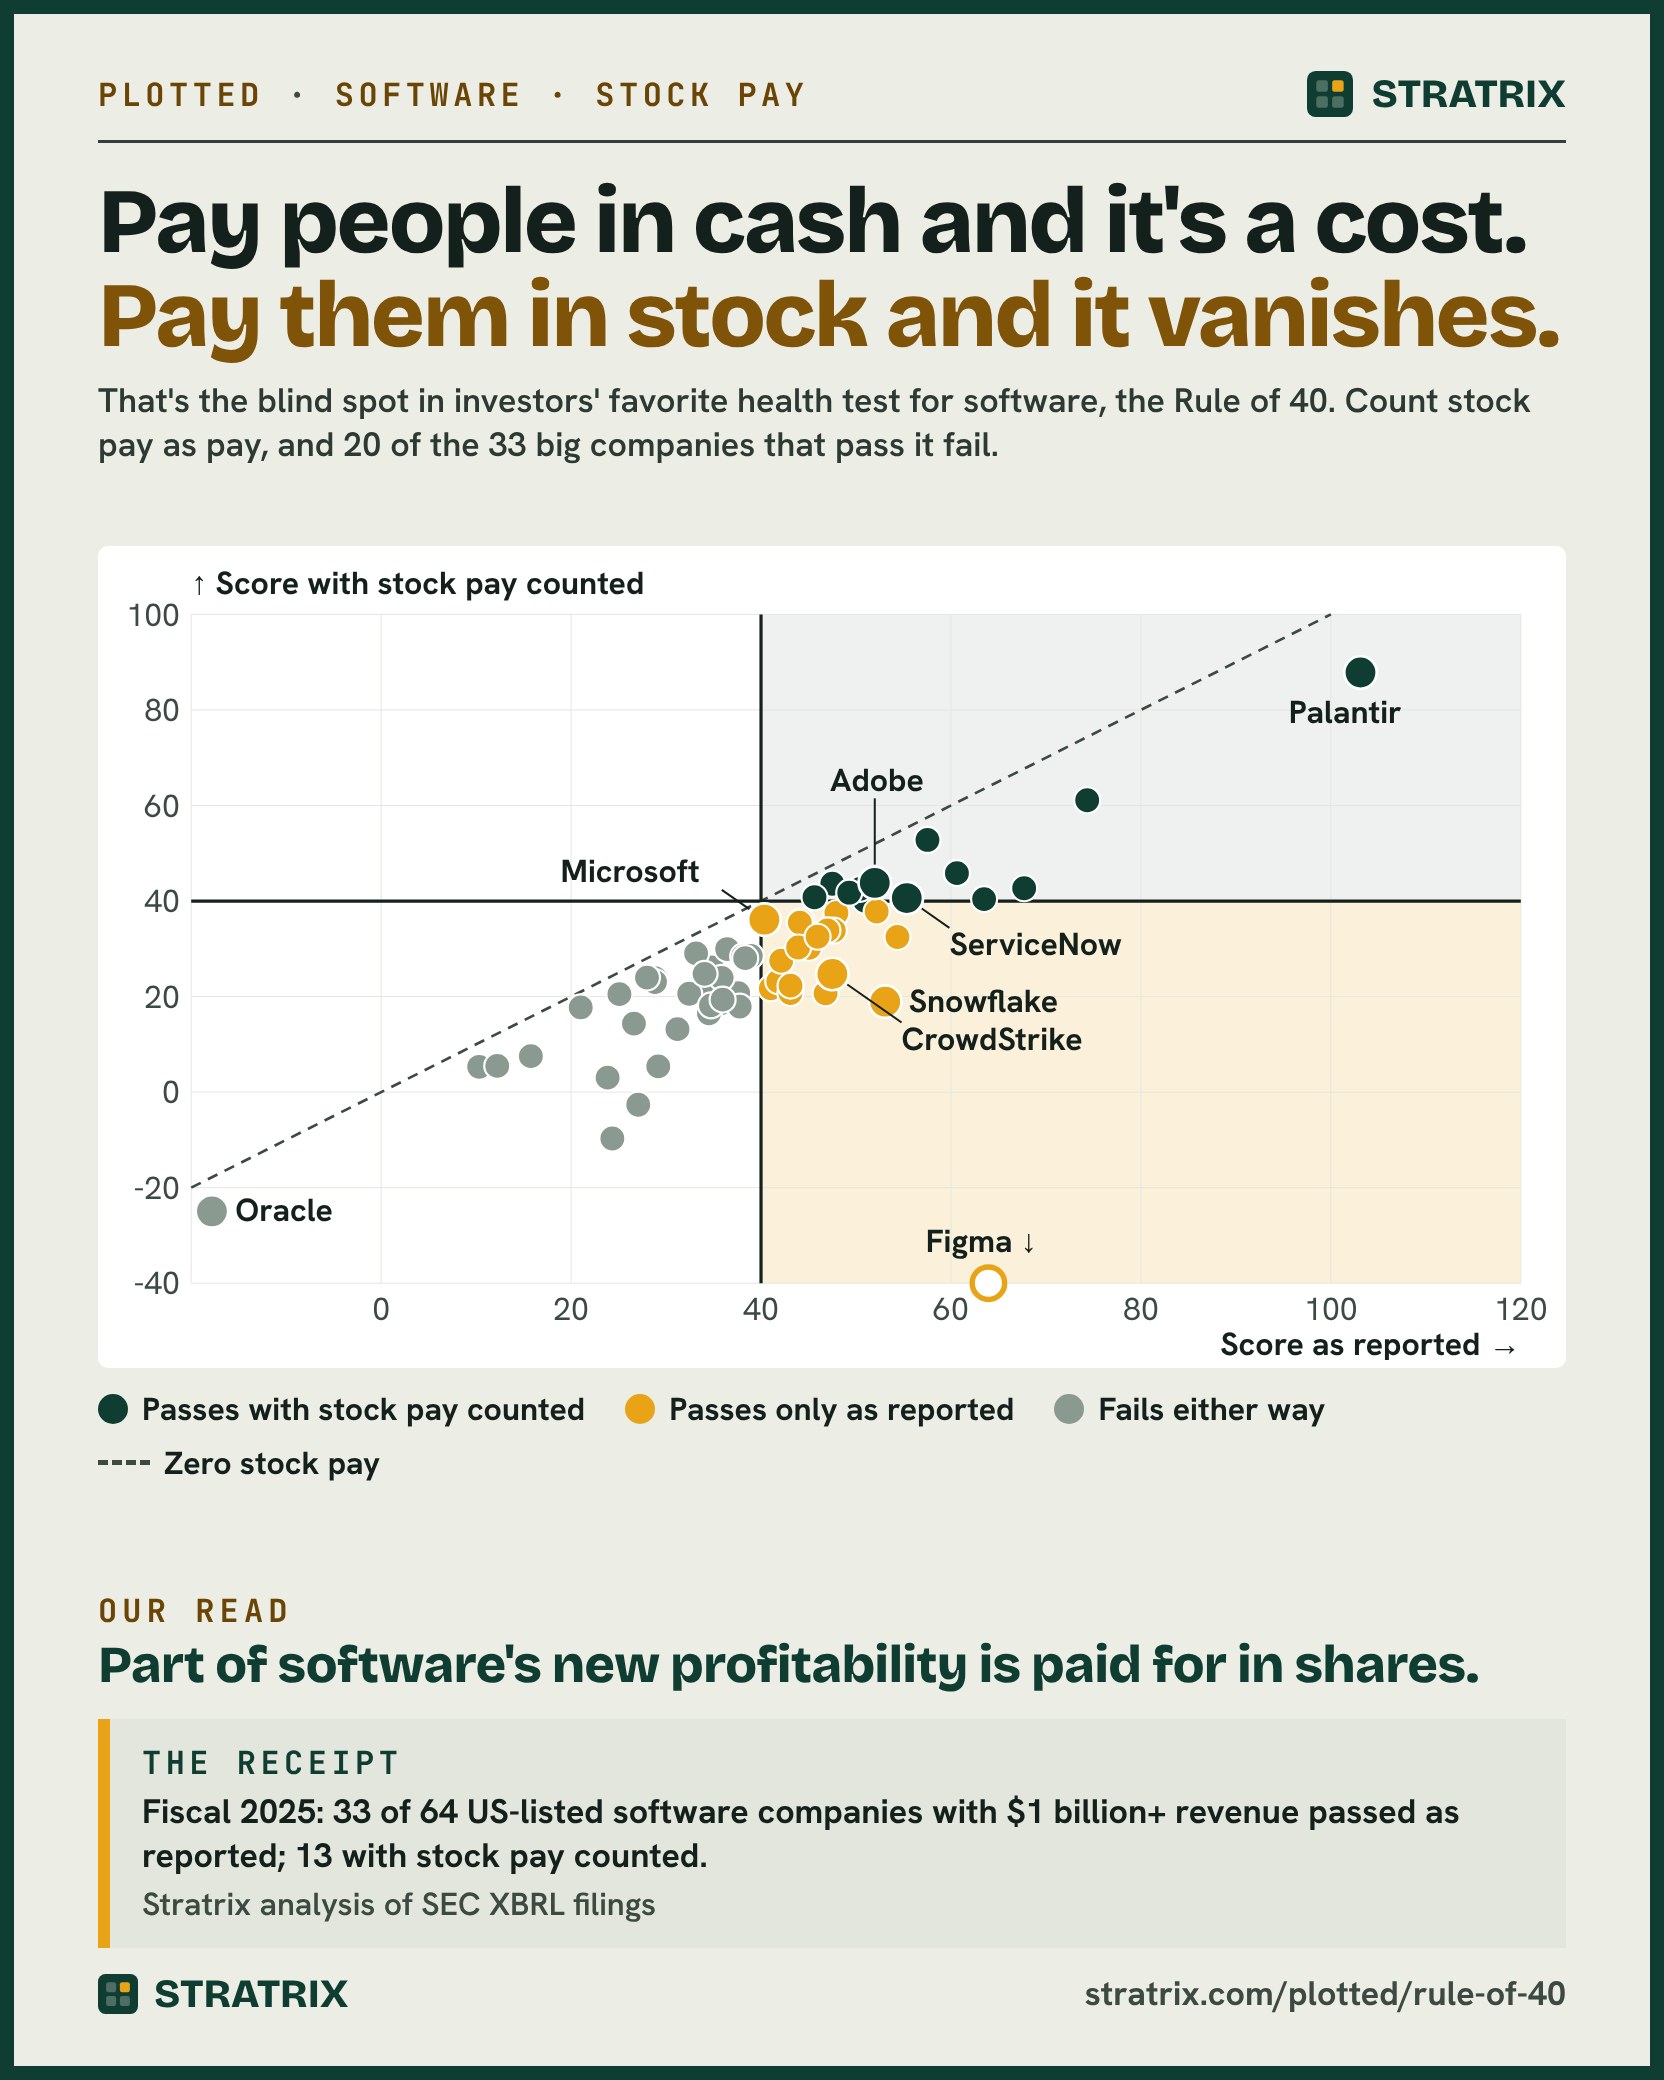
Pay an engineer in cash and it comes out of free cash flow. Pay the same engineer in shares and free cash flow treats it as free. That quirk sits inside the Rule of 40, the test investors and boards use to judge software companies: revenue growth plus free cash flow margin should add up to at least 40.
So a company can raise its score without growing faster or spending less. It only has to pay more of its people in stock. Count stock pay as the pay it is, and most of the companies that pass the test fail it.
Part of software's new profitability is paid for in shares.
Two scores for every company
We took every company in the SEC's industry code for prepackaged software with $1 billion or more of revenue in fiscal 2025: 64 of them. As reported, 33 pass (52%). With stock pay counted, 13 do (20%). The other 20 pass only on paper.
The gap is growing. Between fiscal 2021 and fiscal 2025, median growth fell from 21.6% to 16.0%. Median free cash flow margin rose from 21.1% to 24.0%. Median stock pay rose faster, from 8.4% of revenue to 13.2%. In fiscal 2021, 65% of the 49 companies then in the group passed as reported, and 41% with stock pay counted.
Every dot sits on or below the dashed line, where a company would pay nothing in shares. The distance below the line is the stock pay.
Who passes, and who passes only on paper
- Palantir passes either way: a score of 103 as reported, 88 with stock pay counted. Growth of 56% carries it.
- ServiceNow still passes with stock pay counted, at 41.
- Adobe grows slower, at 11%, but pays only 8% of revenue in stock and scores 44.
- Snowflake scores 53 as reported and 19 with stock pay counted. Its stock pay ran to 34% of revenue.
- CrowdStrike scores 48 as reported and 25 with stock pay of 23% counted.
- Atlassian scores 47 as reported and 21 with stock pay of 26% counted.
- Microsoft fails for a different reason. Its stock pay is only 4% of revenue, but at 40 as reported it had no room to spare.
- Oracle sits at the bottom because it is building: capital spending took its free cash flow margin to -35%.
The case against counting stock pay
Shares don't drain the company's cash. Stock pay costs shareholders, through dilution, until the company spends cash buying back shares to offset it. A company that never buys back can fairly say the score as reported describes its cash. It does not describe what its owners keep.
One year is a snapshot. Figma's stock pay ran to 129% of revenue in its IPO year; it sits off the bottom of the chart. A single year can move a company across the line in either direction.
The bottom of the chart is not about stock. The companies furthest below the bar are building, not paying in shares. Capital spending at Oracle and at CoreWeave (a free cash flow margin of -141%) pulls their scores down. The Rule of 40 penalizes investment by design.
The group is the SEC's label. The prepackaged software code includes game makers, a payments company and cloud infrastructure. Growth includes acquisitions. Fiscal years end in different months; each company's year is the one SEC's data assigns to calendar 2025.
What to do before the next board pack
- Report the score both ways. Show the Rule of 40 as reported and with stock pay counted, side by side. The gap is a number the board should see, not discover.
- Put stock pay next to margin. Track stock pay as a share of revenue on the same chart as free cash flow margin. If margin rises only as fast as stock pay, the business has not become more efficient; the pay mix has changed.
- Count the buybacks. If you buy back shares to cover dilution, count that cash against free cash flow. That is the part of the cost that does reach the company.
- Don't buy the score with cuts. Growth fell faster than margin rose. A hiring freeze can lift the score for a year. Ask what it does to growth the year after.
Score your own company both ways
The calculator is free and the result shows here; the full report (PDF, Word and Excel) comes by email. The packs below take the question further.
Your score, both ways
Enter last fiscal year's figures as percents of revenue, from your income and cash flow statements. The comparison is the group on the chart.
Score as reported: 35 · Score with stock pay counted: 25
Results
| Value | |
|---|---|
| Score as reported | 35 |
| Score with stock pay counted | 25 |
| As reported, against the group's median, in points (above zero: above it) | -5.7 |
| With stock pay counted, against the group's median, in points | 0.3 |
| Points short of the bar with stock pay counted (below zero: you pass) | 15 |
Your inputs
| Value | |
|---|---|
| Revenue growth, year on year | 15% |
| Free cash flow margin: operating cash flow less capex and capitalized software, over revenue | 20% |
| Stock-based pay as a share of revenue | 10% |
About the method
- The group's medians in fiscal 2025: 40.7 as reported, 24.7 with stock pay counted.
- 33 of the 64 companies passed as reported; 13 with stock pay counted.
A comparison with US-listed software companies, from Stratrix's reading of their SEC filings. It is not a rating or advice: what score is right depends on your market, your stage and what your growth costs.
Get the full report: PDF report, Word (editable), Excel
All 64 companies
Show the table
| Company | Ticker | Fiscal year end | Revenue growth | Free cash flow margin | Score as reported | Stock pay, share of revenue | Score with stock pay counted |
|---|---|---|---|---|---|---|---|
| Palantir Technologies Inc. | PLTR | 2025-12-31 | 56.2% | 46.9% | 103.1 | 15.3% | 87.8 |
| Duolingo, Inc. | DUOL | 2025-12-31 | 38.7% | 35.6% | 74.3 | 13.2% | 61.1 |
| Rubrik, Inc. | RBRK | 2026-01-31 | 48.5% | 19.2% | 67.7 | 25.0% | 42.7 |
| Figma, Inc. | FIG | 2025-12-31 | 41.0% | 23.0% | 63.9 | 129.2% | -65.3 |
| Roblox Corp | RBLX | 2025-12-31 | 35.8% | 27.7% | 63.5 | 23.1% | 40.4 |
| VEEVA SYSTEMS INC | VEEV | 2026-01-31 | 16.3% | 44.3% | 60.6 | 14.8% | 45.8 |
| Gen Digital Inc. | GEN | 2026-04-03 | 27.1% | 30.5% | 57.5 | 4.7% | 52.8 |
| ServiceNow, Inc. | NOW | 2025-12-31 | 20.9% | 34.5% | 55.3 | 14.7% | 40.6 |
| Datadog, Inc. | DDOG | 2025-12-31 | 27.7% | 26.7% | 54.4 | 21.9% | 32.5 |
| Snowflake Inc. | SNOW | 2026-01-31 | 29.2% | 23.9% | 53.1 | 34.1% | 18.9 |
| monday.com Ltd. | MNDY | 2025-12-31 | 26.7% | 25.4% | 52.2 | 14.4% | 37.8 |
| ADOBE INC. | ADBE | 2025-11-28 | 10.5% | 41.4% | 52.0 | 8.2% | 43.8 |
| Autodesk, Inc. | ADSK | 2026-01-31 | 17.5% | 33.4% | 51.0 | 10.9% | 40.0 |
| PTC INC. | PTC | 2025-09-30 | 19.2% | 31.3% | 50.5 | 7.9% | 42.6 |
| CHECK POINT SOFTWARE TECHNOLOGIES LTD | CHKP | 2025-12-31 | 6.3% | 43.0% | 49.3 | 7.5% | 41.7 |
| INTUIT INC. | INTU | 2025-07-31 | 15.6% | 32.3% | 47.9 | 10.5% | 37.5 |
| Nutanix, Inc. | NTNX | 2025-07-31 | 18.1% | 29.6% | 47.7 | 13.9% | 33.8 |
| CrowdStrike Holdings, Inc. | CRWD | 2026-01-31 | 21.7% | 25.8% | 47.5 | 22.8% | 24.7 |
| SHOPIFY INC. | SHOP | 2025-12-31 | 30.1% | 17.4% | 47.5 | 3.9% | 43.6 |
| Klaviyo, Inc. | KVYO | 2025-12-31 | 31.6% | 15.4% | 47.0 | 13.1% | 33.9 |
| Atlassian Corp | TEAM | 2025-06-30 | 19.7% | 27.1% | 46.8 | 26.1% | 20.7 |
| Guidewire Software, Inc. | GWRE | 2025-07-31 | 22.6% | 23.3% | 46.0 | 13.4% | 32.5 |
| BENTLEY SYSTEMS INC | BSY | 2025-12-31 | 11.0% | 34.6% | 45.6 | 4.8% | 40.8 |
| Dynatrace, Inc. | DT | 2026-03-31 | 18.8% | 26.2% | 45.1 | 14.8% | 30.2 |
| Salesforce, Inc. | CRM | 2026-01-31 | 9.6% | 34.7% | 44.3 | 8.5% | 35.8 |
| CADENCE DESIGN SYSTEMS INC | CDNS | 2025-12-31 | 14.1% | 30.0% | 44.1 | 8.6% | 35.5 |
| Zeta Global Holdings Corp. | ZETA | 2025-12-31 | 29.7% | 14.2% | 43.9 | 13.6% | 30.3 |
| Cloudflare, Inc. | NET | 2025-12-31 | 29.8% | 13.3% | 43.1 | 20.8% | 22.3 |
| MongoDB, Inc. | MDB | 2026-01-31 | 22.8% | 20.3% | 43.1 | 22.3% | 20.8 |
| Mobileye Global Inc. | MBLY | 2025-12-27 | 14.5% | 27.6% | 42.1 | 14.6% | 27.5 |
| Okta, Inc. | OKTA | 2026-01-31 | 11.8% | 30.0% | 41.8 | 18.6% | 23.2 |
| DOCUSIGN, INC. | DOCU | 2026-01-31 | 8.2% | 32.9% | 41.0 | 19.3% | 21.7 |
| MICROSOFT CORP | MSFT | 2025-06-30 | 14.9% | 25.4% | 40.4 | 4.3% | 36.1 |
| COMMVAULT SYSTEMS INC | CVLT | 2026-03-31 | 18.9% | 20.0% | 38.9 | 10.4% | 28.5 |
| MANHATTAN ASSOCIATES INC | MANH | 2025-12-31 | 3.7% | 34.6% | 38.3 | 10.3% | 28.0 |
| Paylocity Holding Corp | PCTY | 2025-06-30 | 14.8% | 23.3% | 38.1 | 9.7% | 28.4 |
| BOX INC | BOX | 2026-01-31 | 8.0% | 29.8% | 37.8 | 19.9% | 17.9 |
| HUBSPOT INC | HUBS | 2025-12-31 | 19.2% | 18.4% | 37.6 | 16.9% | 20.7 |
| TYLER TECHNOLOGIES INC | TYL | 2025-12-31 | 9.1% | 27.3% | 36.4 | 6.5% | 29.9 |
| CCC Intelligent Solutions Holdings Inc. | CCC | 2025-12-31 | 11.9% | 24.1% | 36.0 | 16.6% | 19.4 |
| DROPBOX, INC. | DBX | 2025-12-31 | -1.1% | 36.9% | 35.9 | 11.9% | 23.9 |
| Elastic N.V. | ESTC | 2026-04-30 | 17.3% | 18.5% | 35.8 | 17.2% | 18.6 |
| ELECTRONIC ARTS INC. | 2026-03-31 | 0.9% | 33.9% | 34.8 | 8.7% | 26.1 | |
| BILL Holdings, Inc. | BILL | 2025-06-30 | 13.4% | 21.4% | 34.7 | 16.6% | 18.1 |
| UiPath, Inc. | PATH | 2026-01-31 | 12.7% | 21.9% | 34.5 | 18.0% | 16.5 |
| SYNOPSYS INC | SNPS | 2025-10-31 | 15.1% | 19.1% | 34.3 | 12.7% | 21.6 |
| ZoomInfo Technologies Inc. | GTM | 2025-12-31 | 2.9% | 31.2% | 34.1 | 9.3% | 24.8 |
| SS&C Technologies Holdings Inc | SSNC | 2025-12-31 | 6.6% | 26.5% | 33.2 | 4.1% | 29.1 |
| TWILIO INC | TWLO | 2025-12-31 | 13.7% | 18.8% | 32.4 | 11.8% | 20.6 |
| PROCORE TECHNOLOGIES, INC. | PCOR | 2025-12-31 | 14.8% | 16.4% | 31.2 | 18.0% | 13.2 |
| SailPoint, Inc. | SAIL | 2026-01-31 | 24.4% | 4.8% | 29.2 | 23.8% | 5.4 |
| Paycom Software, Inc. | PAYC | 2025-12-31 | 8.9% | 19.9% | 28.8 | 5.8% | 23.0 |
| NICE Ltd. | NICE | 2025-12-31 | 7.7% | 21.1% | 28.8 | 5.0% | 23.9 |
| ACI WORLDWIDE, INC. | ACIW | 2025-12-31 | 10.4% | 17.6% | 28.0 | 4.0% | 24.0 |
| SentinelOne, Inc. | S | 2026-01-31 | 21.9% | 5.2% | 27.1 | 29.7% | -2.6 |
| CoreWeave, Inc. | CRWV | 2025-12-31 | 167.9% | -141.3% | 26.6 | 12.3% | 14.3 |
| TAKE TWO INTERACTIVE SOFTWARE INC | TTWO | 2026-03-31 | 18.2% | 6.9% | 25.1 | 4.6% | 20.5 |
| Confluent, Inc. | 2025-12-31 | 21.1% | 3.3% | 24.3 | 34.1% | -9.7 | |
| Unity Software Inc. | U | 2025-12-31 | 2.0% | 21.8% | 23.8 | 20.8% | 3.0 |
| Alarm.com Holdings, Inc. | ALRM | 2025-12-31 | 7.6% | 13.4% | 21.0 | 3.3% | 17.7 |
| BLACKBAUD INC | BLKB | 2025-12-31 | -2.3% | 18.0% | 15.8 | 8.2% | 7.5 |
| TERADATA CORP /DE/ | TDC | 2025-12-31 | -5.0% | 17.2% | 12.2 | 6.7% | 5.5 |
| Block, Inc. | XYZ | 2025-12-31 | 0.3% | 10.0% | 10.3 | 5.0% | 5.3 |
| ORACLE CORP | ORCL | 2026-05-31 | 17.3% | -35.2% | -17.8 | 7.1% | -25.0 |
Download the data (CSV). Free to use with credit to Stratrix.
Method
- Who is in it. Every company in the Stratrix SEC universe (filers with $1 billion or more of revenue in any year since 2016, including those since acquired or delisted) whose current SEC record carries the industry code for prepackaged software, with $1 billion or more of revenue in the fiscal year.
- Where the figures come from. SEC XBRL frames: one value per company for the fiscal year SEC assigns to the calendar year (the one it overlaps most), downloaded 2026-10-28 and frozen. US GAAP filers only; companies reporting under IFRS are not in the frames.
- How they are computed. Growth is revenue against the year before, on the same revenue line. Free cash flow is operating cash flow less purchases of property and equipment and capitalized software. Stock pay is share-based compensation from the cash flow statement, or the expense where only that is tagged. The score is growth plus free cash flow margin; with stock pay counted, it is the same less stock pay as a share of revenue.
- Who is left out. 4 companies that report in renminbi and also tag a dollar translation: their growth would mix in the exchange rate.
Sources
- SEC EDGAR application programming interfaces: XBRL frames (data.sec.gov)
- Each company's annual report on SEC EDGAR, as tagged in XBRL
One strategic question, plotted, every week. Free, with the data.
Share this chart
More from Stratrix
“Has the thing your headline number stands for kept up with the number?”
See the pack — $499 →Weekly email
Stratonomics, every Tuesday
One data story every Tuesday: what happened, what it means, and the figures you can quote. Free.
Strategic Decisions
The big calls companies keep facing, told through the 819 companies on record that made them.
24 decisionsFind your decision →Test a decision, free
Set a live decision against the companies that made it before you.
AcquisitionsThe Distance TestDivestituresThe Divestiture TestDiversificationThe Diversification TestMake or buyThe Make-or-Buy Test