Core insight
Almost every price rise reaches the meeting with one number, a margin target or an inflation figure, and the decision needs two. The second, what your own last rise cost in volume, is already in your sales history and takes an afternoon to produce.
Why a margin target is not evidence of pricing power
Ask how a price rise was arrived at and the answer is a margin target, an inflation figure or a competitor's list price. Each says what the company wants or what someone else did. None says what your customers will do when the new price reaches them.
Ask what the last rise cost in volume and the room usually goes quiet. That number sits in the company's own sales history. It takes one real rise, one market, one date, and what volume did afterward measured against what it was doing before.
This page is about raising what you charge on the model you already have. Changing how you charge, from licenses to subscription or from seats to usage, moves the unit, the cash shape, the buyer and the promise, and is covered in the guide to pricing model change.
How much volume can this rise afford to lose, and how much will it? The first is arithmetic on the rise and the margin. The second is evidence, and it is in your own history.
The two numbers, and the two things that move them
| The number | Where it comes from | How it goes wrong |
|---|---|---|
| The walk rate: the volume the rise can afford to lose | The rise and the contribution margin on the line it applies to. The affordable loss is the rise divided by the margin plus the rise. | Nobody has a contribution margin for the line, only a gross margin for the company. |
| The measured walk: what the last rise lost | One real rise in one market, and volume afterward against the trend before it. | No past rise was ever measured, so the room argues from targets. |
| The realization rate | The announced rise against the change in average selling price that actually landed. | The field discounts the rise away. The contribution gained falls and the volume lost stays where it was. |
| The year the walk lands | Contract terms, renewal dates and notice periods. | Contracts are read as protection. They do not prevent the walk; they choose the year it lands in. |
The first two numbers decide the rise. The gap between them, in points of volume, is the headroom, and the highest rise your evidence supports is the largest one where the headroom is still positive. The last two decide whether the rise you announce is the rise you get, and when its cost shows up.
A worked example
In the worked case used in the Pricing Power Strategy Pack, an 8% rise can afford to lose 16.0% of volume, and the company's own last rise says it will lose 14.4%. It clears by 1.6 points, which is inside what a single measurement can be wrong by. That is the finding, not a caveat.
Rises that held: what the customers who stayed compared against
Chick-fil-A's menu prices rose about 55% from 2014 to 2024, ahead of national CPI inflation of about 33% but well below McDonald's, which rose about 100% over the same decade. Chick-fil-A took its rises in waves, roughly 15% in 2022 and roughly another 6% at the start of 2023, and its systemwide sales climbed to $23.9 billion in 2025. The rise held with a mark on it: Chick-fil-A's freestanding average unit volume dipped 1.7% from 2024 to 2025.
Amazon raised the annual US Prime fee from $79 to $99 in March 2014, three years after adding streaming video to the bundle at no charge. Each rise landed on a richer bundle than the one members had signed up for, and by 2021 Amazon had passed 200 million Prime members worldwide.
Uniqlo moved its fleece zip jacket from ¥1,990 to ¥2,990 in 2022, against a low-price image, citing raw-material and distribution costs and a sliding yen. Fast Retailing posted a 53.9% gross margin in fiscal 2024 and ¥500.9 billion in operating profit, up 31.4%.
T-Mobile chose where the rise fell. In 2024 T-Mobile raised prices only on its older legacy plans, by $2 or $5 per line, while postpaid service revenue reached $52.3 billion for the year.
None of these companies published a measured walk rate. Each shows that a rise held. None shows what the same rise would have cost a company whose customers had somewhere cheaper to go.
Rises that found a line
Mondelez passed record cocoa costs through as price in 2025. In the third quarter Mondelez's chocolate organic sales rose 8% on cocoa-driven pricing while chocolate volume/mix slid 11%. For the full year Mondelez's earnings fell 44.7%, and gross margin fell to 28.4% from 39.1% in 2023.
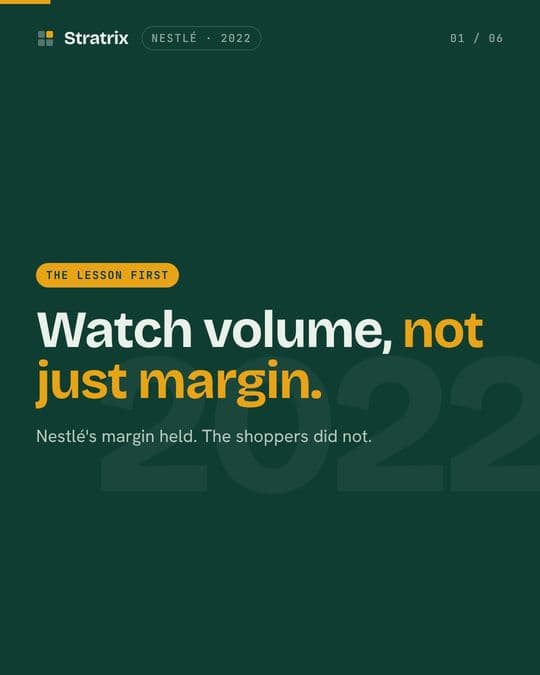
Nestlé chose to pass costs through in 2022, with pricing of 8.2% against real internal growth of 0.1%. Nestlé's UTOP margin held at 17.3% through 2023 while real internal growth turned negative at -0.3%. The board replaced Mark Schneider with Laurent Freixe effective 1 September 2024, after a cut to the growth forecast.
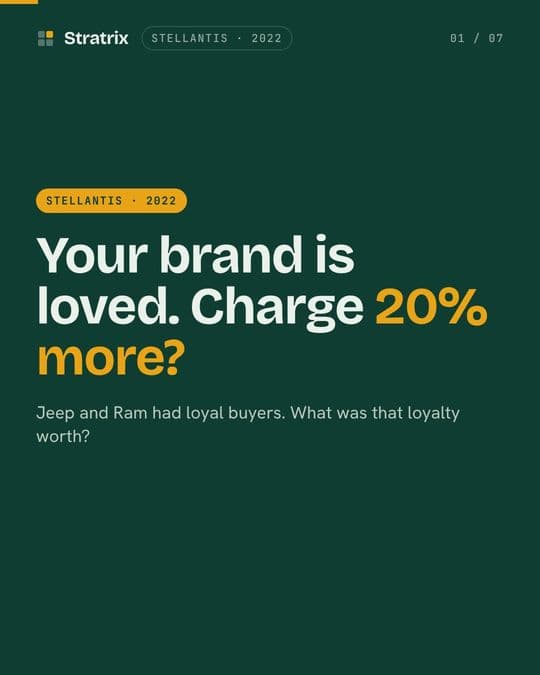
Stellantis let the Jeep and Ram premium widen from about 5% above the industry average to more than 20% during 2022 and 2023, on the assumption that the brand would absorb it. Stellantis's US market share fell from 10.2% in the first half of 2023 to 8.4% a year later. In 2024 Stellantis's US sales fell about 15% and net profit fell 70%, and Carlos Tavares resigned on December 1, 2024.
The opposite choice is also a price decision. IKEA cut prices by roughly 10% in fiscal 2024 to hold its low-price doctrine; IKEA's total retail sales fell 5.3% to EUR 45.1 billion, and Ingka Group's net income fell from EUR 1.5 billion to EUR 0.8 billion.
In each of these cases the first clear evidence of the line was volume, and it came after the price had moved. A measured walk from your last rise will not always show the line in advance either. It gives you a headroom to watch, not a verdict.
When the field, the channel or a contract sets the real price
Stellantis is also the clearest realization case. Stellantis brands carried well over twice the industry-average days' supply throughout 2024, and by the end of that year the average transaction price had narrowed back toward the market average. The announced premium was not the price that landed.
PepsiCo met its limit at the retailer rather than the shopper. In January 2024 Carrefour stopped selling PepsiCo's brands in at least five countries, citing unacceptable price increases. A deal for France came roughly three months later, and neither side disclosed the commercial terms.
Spotify held its US individual price at $9.99 from its 2011 launch through 2022, with label negotiations as the gating condition. Spotify moved to $10.99 in July 2023, after Apple Music and Amazon Music had moved first, and to $11.99 in June 2024. Spotify's Premium gross margin sat around 28-29% in the quarters either side of the first rise.
Coca-Cola is the limit case. A 6.5-ounce Coca-Cola cost five cents from 1886 to 1959, 73 years, held there by a bottler contract that encouraged retail price maintenance and by single-coin vending machines. In 1953 Coca-Cola's president, Robert Woodruff, asked President Eisenhower for a 7.5-cent coin, and the request was declined.
Contracts and notice periods decide the year the walk lands. When Amazon raised the annual Prime fee from $119 to $139 in February 2022, the new price applied from February 18 for new members and after March 25 for existing ones. The first year after a rise is rarely the steady state.
What these cases show
Each case is drawn from the Stratrix case library and checked against the filings and reporting listed under Sources. The last column says what each one does not establish.
| Company | What moved | What happened | What it does not establish |
|---|---|---|---|
| Chick-fil-A, 2022 | Menu prices, in waves, below the chain used as the yardstick | Systemwide sales of $23.9 billion in 2025; freestanding unit volume down 1.7% | What the same rises would have done had McDonald's not risen faster |
| Amazon Prime, 2014 | The annual fee, after the bundle grew | More than 200 million members by 2021 | How many members a bare rise on the old bundle would have lost |
| Uniqlo, 2022 | Core items, against a low-price image | Gross margin of 53.9% in fiscal 2024 | How much of the profit came from price rather than currency or mix |
| T-Mobile, 2024 | Legacy plans only, by $2 or $5 per line | Postpaid service revenue of $52.3 billion | How many legacy customers left |
| Mondelez, 2025 | Chocolate prices, to pass through cocoa | Chocolate volume/mix down 11%; earnings down 44.7% | How much of the volume loss was price rather than cost-of-living pressure |
| Nestlé, 2022 | Pass-through across the group | Real internal growth of -0.3% in 2023; CEO replaced in 2024 | That a smaller rise would have kept the volume |
| Stellantis, 2022 | A premium past 20% above the market | US share from 10.2% to 8.4%; net profit down 70% in 2024 | How much of the fall was price rather than discontinued models |
| IKEA, 2024 | A deliberate cut of roughly 10% | Retail sales down 5.3% | What a rise would have cost IKEA in volume |
| Coca-Cola, 1899 | Nothing: the price was not Coca-Cola's to move | Five cents for 73 years | What the frozen nickel cost in profit |
Running the decision
A sequence for the team setting the rise
Measure the last rise
One real rise, one market, one date, and volume afterward against the trend before it. If no past rise has ever been measured, stop here: that is the first halt, and it is an afternoon in data you already hold.
Build the contribution margin for the line
Price minus the costs that leave with the volume, for the line the rise applies to. If no one can produce it, that is the second halt.
Compute what the rise can afford to lose
The rise divided by the margin plus the rise. Do it for a range of candidate rises, not just the one in the plan.
Put the two numbers side by side
The gap, in points of volume, is the headroom. A gap smaller than what one measurement can be wrong by is a reason to rise less or to stage the rise.
Check realization
Compare the last two announced rises with the change in average selling price that actually landed, and use the net rise in the arithmetic.
Date the walk and name who watches it
Read the contract and renewal terms to find the first year the walk lands, and give one person a monthly volume line to report after the rise.
What this method cannot tell you
It does not tell you whether you have pricing power. It measures what yours was worth once, in one direction, at one price, and a company that has raised successfully for years can still find a line that no earlier measurement would have shown.
It cannot see what a rise does to the customers who stay: how often they buy, what they trade down to, and what they quietly stop buying alongside. And the cases above support recognizing a pattern, not a rate. None of them is a controlled test, and this page does not claim one.
Watch these decisions
Short videos built from the same Decision Records as this page.
Questions
How much should we raise prices?
As far as your evidence supports, not as far as a margin target asks. Work out the share of volume the rise can afford to lose from the rise and your contribution margin, measure what your last rise actually lost, and take the highest rise where the first number still exceeds the second by more than a measurement can be wrong by.
How do you calculate how much volume a price increase can lose?
Divide the rise by the contribution margin plus the rise, both as a share of the current price. That is the share of volume you can lose before the rise earns less contribution than not raising at all. Use the contribution margin on the line, not the company's gross margin.
How do I know how customers will react to a price increase?
Look at your own last rise. Take one market and one date, and compare volume afterward with the trend before it. It is better evidence than a survey or a competitor's experience, because it is what your customers actually did.
Should we pass cost inflation through to prices?
Inflation is a reason to raise, not evidence that customers will absorb it. Mondelez passed record cocoa costs through in 2025 and saw chocolate volume/mix slide 11%. Uniqlo passed its costs through in 2022 and posted a 53.9% gross margin in fiscal 2024.
Do contracts protect us from customers leaving after a price rise?
No. They choose the year the loss lands in. Date when each contract renews, and model the first year after the rise separately from the steady state.
Is this the same as changing our pricing model?
No. A rise changes how much you charge on the unit you already sell. Moving to subscription, seats or usage changes the unit itself, the shape of the cash and who signs, and needs a different analysis.
Continue learning
Sources & further reading
- TheStreet / Yahoo Finance (2025). Chick-fil-A keeps winning big while quietly increasing prices.
- Newsweek (2023). Chick-fil-A Prices Are Skyrocketing.
- Restaurant Business (citing Chick-fil-A's 2025 Franchise Disclosure Document) (2026). Chick-fil-A's unit volumes hit a ceiling.
- Wikipedia (2014). Amazon Prime.
- TechCrunch (2022). Amazon is increasing the annual price of Prime to $139 in the US.
- Amazon.com (2021). 2020 Letter to Shareholders.
- Time Out Tokyo (citing Yomiuri Shimbun and Nikkei) (2022). Uniqlo to raise prices of autumn and winter wear by up to ¥1,000.
- Fast Retailing Co., Ltd. (2024). Results Summary for Fiscal 2024.
- T-Mobile US, Inc. (2025). Form 10-K, FY2024.
- Yahoo Finance (2025). T-Mobile hopes to win back angry customers with generous offers.
- Food Business News (2025). Mondelez International cuts 2025 outlook.
- Food Ingredients First (2026). Mondelēz earnings nearly halve as record cocoa costs overshadow revenue growth.
- Nestlé S.A. (2023). Nestlé reports full-year results for 2022.
- Nestlé S.A. (2024). Nestlé reports full-year results for 2023.
- CNN Business (2024). Nestle replaces CEO Schneider with company veteran Freixe.
- Stellantis N.V. (2025). Full Year 2024 Results Press Release.
- Stellantis N.V. (2024). 2024 Semi-Annual Report.
- Haig Partners (2025). Stellantis Recalibrates: A Pivotal Shift in Pricing, Product Strategy, and Market Share.
- Stellantis N.V. (Form 6-K) (2024). Board Accepts Carlos Tavares' Resignation as Chief Executive Officer.
- Stellantis North America (FCA US LLC) (2025). FCA US Reports Fourth-quarter and Full-year 2024 Sales Results.
- Ingka Group (2024). Ingka Group prioritises affordability and long-term business resilience.
- Bloomberg (2024). Carrefour Pulls PepsiCo Products From Shelves Amid Price Dispute.
- Beverage Daily (2024). PepsiCo products back on shelves in Carrefour after price increase dispute.
- Keeping Up With Inflation (2026). The Spotify Index: 2015-2026 Price Tracker.
- Spotify Newsroom (2023). Adjusting Our Spotify Premium Prices.
- CNBC (2024). Spotify price increased again.
- Spotify Technology S.A. (Form 6-K) (2023). Form 6-K, Quarter Ended September 30, 2023.
- Music Business Worldwide (2023). Now YouTube Music has raised its monthly price in the US. Is Spotify next?.
- Billboard (2023). YouTube Raises Prices on Music, Premium Individual Plans in the U.S..
- Journal of Money, Credit and Banking (Levy and Young) (2004). 'The Real Thing': Nominal Price Rigidity of the Nickel Coke, 1886-1959.
- Journal of Money, Credit and Banking (Levy and Young) (2004). 'The Real Thing': Nominal Price Rigidity of the Nickel Coke.
More to learn
Other foundational guides worth reading.
Free Tier Strategy: When Does Freemium Pay for Itself?
A free tier pays for itself when the share of free users who start paying each year clears the break-even conversion rate: what one free user costs a year, net of what they earn, divided by what one conversion is worth. The paying-over-total ratio in most decks is not that rate, and some free tiers are paid for by another side of the market or by a layer sold on top, not by converts.
Pricing StrategyPrice War Response: When to Match a Rival's Price Cut, or Hold
Matching a rival's cut costs the cut on every unit you sell; holding costs only the volume that leaves. Work out the share of volume you can lose before holding costs more than matching, compare it with how much of your volume the rival can actually reach, and price a guarantee that matches only where customers ask.
Pricing StrategyProduct Bundling Strategy: When to Sell Together or Apart
A bundle first hands its discount back to every customer already paying for both products, and earns only on the customers it adds and the extra years bundled customers stay. Match the two customer lists to size the handback, measure the retention gap, and solve for the deepest discount at which selling together still beats selling apart.
Strategy FundamentalsWhat Is Strategy? A Complete Guide
Understand the foundations of strategic thinking—and why most organizations get it wrong.
Strategy DevelopmentWhen to Discontinue a Product: How to Price a Sunset Before You Announce It
Every room knows what a product loses a year. Almost none knows what its customers spend with the company on everything else, or how many would leave with it. That second number decides whether retiring it saves money or costs it.
Growth & ExpansionExpansion Plan: How Fast Can a Rollout Actually Go?
Plans express themselves as destinations: two hundred stores, twelve countries. A destination cannot be wrong, only late. A rate can be checked, and most expansions fail because the rate was faster than the operation behind it could carry.
See this framework in the wild.
Follow it across the companies and lenses where it actually shaped the strategy.