Core insight
The conversion figure in most decks is paying users over all users, a ratio of two stocks that keeps rising after conversion has stopped. The number that decides a free tier is the flow, the share of the free base that started paying this year, set against the break-even conversion rate your own cost per free user implies.
Why a free tier is neither a cost nor an engine
By the time a free tier reaches an agenda, finance is calling it a cost and growth is calling it an engine. Both are holding the wrong number. The cost is usually an allocation that charges the free tier for the paying tier's usage, and the conversion figure is usually paying users over all users.
Neither number settles the question, which is narrower: is the share of free users who start paying large enough to cover the ones who never do? A free tier that fails that test can still be the cheapest way you buy a customer. A free tier that passes it can still take more than a year to pay back.
What share of the free has to convert before the free pays for itself, and how far is the real conversion rate above that share?
The one division: the break-even conversion rate
The method reduces the decision to one division and two readings around it. Every input has a usual way of going wrong, and the wrong version is the one already in the deck.
| The input | What it is | How it usually goes wrong |
|---|---|---|
| Cost of a free user | What one free user costs a year to serve, net of what they earn directly. | It is an allocation of total cost, not a measure of what free usage costs. |
| Value of a conversion | What one convert pays across the years a convert stays. | It assumes converts stay as long as customers who were never free. |
| Break-even conversion rate | The first divided by the second: the share of the free that must start paying each year. | Nobody computes it, so the ratio in the deck is compared to nothing. |
| The flow | The share of this year's free base that started paying this year. | The deck quotes paying users over all users instead. |
| The cushion | The flow less the break-even rate: how far conversion can fall before the free stops paying. | It is read as safety while the payback is still longer than a year. |
In the worked case used in the Free Tier Strategy Pack, a fictional company has a free tier of 3.8 million monthly active users who cost $2.60 each to serve and earn $0.40, so the free base costs $8.36m a year. Its deck quotes 5.9 percent conversion. The flow, 61,000 free users who started paying last year, is 1.6 percent. One conversion is worth $292, so the break-even rate is 0.75 percent and the cushion is 0.85 points.
The free pays for itself twice over, and a year's free base still takes 1.3 years to pay back, which is the finding finance was actually describing. At the cost per free user finance had been carrying, the break-even rate would have been 1.95 percent and the tier would have been cut.
Two conditions before the division means anything
The cost of a free user has to come from usage data, not from an allocation of total cost. Conversion has to be counted as a flow, this year's new payers over this year's free base, not quoted as a ratio of two stocks. Almost no company has met both, and until it has, the analysis should stop rather than answer.
Count the flow, not the ratio
The best-known free tiers report a stock of payers, not a flow of conversions. Only three of the nine free tiers in the Free Tier Strategy Pack carry a conversion figure of any kind, and none of the three is a flow.
Spotify's founders bet in Stockholm in 2006 that they could give the product away, with ads and some friction, and that a slice of listeners would pay to remove the friction. By late 2024 Spotify had 675 million monthly users and 263 million subscribers. That proportion is the famous 40% conversion rate, and it is a ratio of two stocks: no filing says what share of the free base started paying in any year.
The free tier also took a long time to pay. Spotify's first full year of operating profit came in 2024, with royalties consuming about 70% of revenue and gross margin reaching only 32.2% even in its record fourth quarter. The free tier bankrolled a decade and a half of losses before the pocket it was built for paid.
The New York Times built a metered free tier on March 28, 2011: 20 free articles a month, with readers arriving from search, blogs or social links not counted at all. By December 31, 2025 the Times had about 12.78 million total subscribers and operating profit of $431.6 million. It counts subscribers and never the free readers, so its figures show that the pocket pays without showing at what rate the free converts.
Netflix had a free tier it never designed: more than 100 million households sharing a password, by its own estimate in 2022. Netflix tested paid sharing in Chile, Costa Rica and Peru in 2022, then launched it in the United States and more than 100 markets on May 23, 2023, at $7.99 a month per extra member in the US. Paid net adds were 5.9 million in the second quarter of 2023, and net adds reached a record 13.1 million in the fourth. Netflix does not attribute those additions to former borrowers, so even this conversion is reported as net additions rather than as a flow.
Find the pocket that pays: the other side
The convert is only one of three pockets that can pay for a free tier. In the second, the free product goes to one side of a market so that another side pays, and the conversion rate of the free users is the wrong test.
Google bought Android for a figure estimated at about $50 million and then chose not to sell it. Rather than license it to handset makers for a fee, Google made Android free and open-source and in November 2007 organized 34 companies into the Open Handset Alliance. Its aim was to keep its services at the default center of mobile and protect search, not to be in the operating-system business. No handset maker converts; search pays.
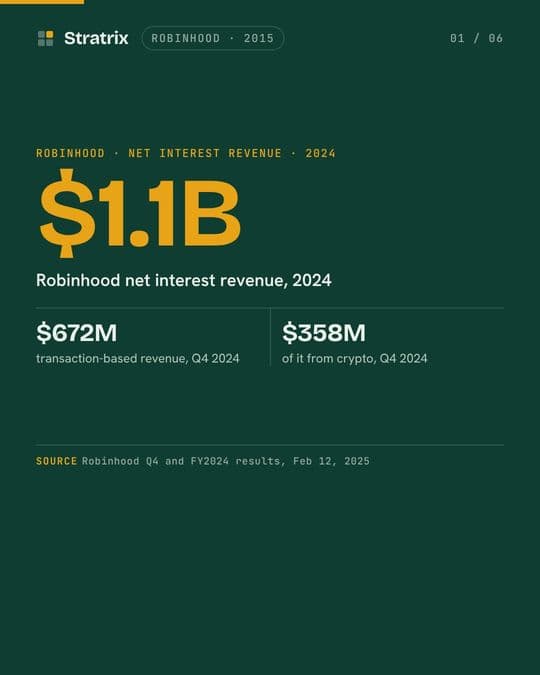
Robinhood launched its trading app in 2015 with free trades as the default. The free trade was the loss leader, and the cash and shares it parked on the platform were the product. In 2024 Robinhood's net interest revenue was roughly $1.1 billion, larger than its transaction-based line, on total net revenues of $2.95 billion.
The other pocket has costs of its own. In December 2020 the SEC found Robinhood customers had received inferior prices that deprived them of $34.1 million in aggregate even after accounting for zero commissions, and Robinhood paid a $65 million civil penalty.
Alibaba used free listings to take a market. When eBay bought EachNet in 2003, which then held 85% of China's consumer-to-consumer market, Alibaba launched Taobao with free listings for sellers against eBay's fees, and with Alipay escrow to supply the trust the market lacked. By 2006 eBay had shut its standalone China operations. The case shows free listings taking a market; it does not show which pocket paid for them.
The layer on top: free users who buy, and free users who do not
The third pocket is a layer sold on top of the free product. It can pay for everything or for nothing, and the difference is whether the free users are the ones buying the layer.
Epic planned to sell Fortnite Battle Royale inside its paid game and, two weeks before launch, released it free instead, worried that charging up front would strangle growth. It went live on September 26, 2017 with a promise: "we will not sell items that give a competitive advantage." The money came from V-Bucks, the currency players buy to spend inside the game. Fortnite is estimated to have earned $3.5 billion in 2023, around 80% of Epic's total, though Epic does not publish consolidated financials.
The layer can be repriced once the base depends on it. In March 2026 Epic reduced V-Bucks purchasing power for the first time: the $8.99 pack that once bought 1,000 V-Bucks now bought 800.
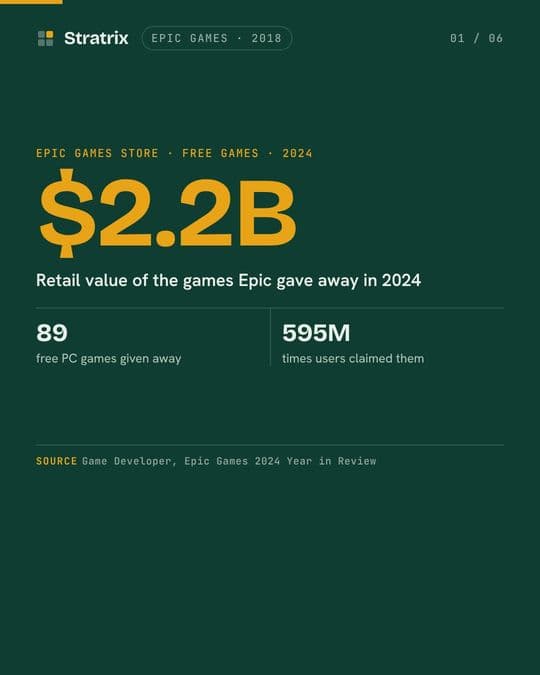
The Epic Games Store is the other end. It launched in December 2018 with a 12% cut for developers against Steam's 30%, and gave away premium games week after week. Between 2019 and 2024 the Epic Games Store grew from 108 million to 295 million registered PC users, while third-party revenue, what players spend on games Epic does not own, moved from roughly $251 million to $255 million. In 2024 alone it gave away 89 games with a retail value of about $2.2 billion.
In November 2023 the store's general manager said in court that it was still not profitable and that growth remained the goal. The free base grew; the layer it was meant to feed did not.
Before you close it, price the free
A free tier that does not pay for itself is not automatically one to close. The lever is often the cost of the free rather than the free, and charging from the first day has a record of its own.
HubSpot capped its free tools at a maximum of five edit seats from March 5, 2024, with unlimited free view-only users, a cap that did not exist under its earlier model. HubSpot's stated aim was to let customers start for free and "pay as they grow." That is a move on the cost and shape of the free tier, not a decision to end it.
Quibi tried the opposite and charged from the start. Quibi launched on April 6, 2020, selling a subscription to short-form video against TikTok and YouTube, which charged nothing, and spent over $1 billion commissioning more than 8,500 episodes. It had projected 7.4 million paying subscribers in its first year. Quibi announced its shutdown on October 21, 2020, and its library went to Roku for "significantly less than $100 million."
Quibi had no free tier to judge. Its case is the other column of the comparison: what a customer costs through the paid channel when a competitor's product is free. The method puts that cost beside the cost of a customer bought through the free.
What these cases show
Each case is drawn from the Stratrix case library and checked against the filings and reporting listed under Sources. The last column says what each one does not establish.
| Company | Who pays for the free | What happened | What it does not establish |
|---|---|---|---|
| Spotify, 2006 | The convert | 263 million subscribers among 675 million monthly users in late 2024; first full year of operating profit in 2024 | What share of the free started paying in any year |
| The New York Times, 2011 | The convert, through a meter | About 12.78 million total subscribers by the end of 2025 | How many free readers there are, or what share convert |
| Netflix, 2022 | The convert: borrowers asked to pay | Paid net adds of 5.9 million in the second quarter of 2023 | How many of the additions were former borrowers |
| Google Android, 2007 | The other side: search | Made free and open-source, with a 34-company alliance behind it | What the free system earned through search |
| Robinhood, 2015 | The other side: order flow and interest | Net interest revenue of roughly $1.1 billion in 2024 | Whether customers who traded free came out ahead |
| Alibaba Taobao, 2003 | Free listings against a fee model | eBay shut its standalone China operations by 2006 | Which pocket paid for the free listings |
| Fortnite, 2017 | The layer on top: V-Bucks | An estimated $3.5 billion in 2023 | What one free player is worth; Epic does not publish it |
| Epic Games Store, 2018 | A layer the free base did not buy | Users rose from 108 million to 295 million; third-party revenue stayed near $255 million | That giveaways cannot work for a store with stronger content |
| HubSpot, 2024 | The convert, with the free capped | Free tools limited to five edit seats | Any outcome; none is dated yet |
| Quibi, 2020 | No free tier, against free rivals | Shutdown announced in October 2020 | What a free tier would have cost it |
Running the decision
A sequence for the team deciding on a free tier
Name the pocket
The convert, the other side, or a layer on top. If it is not the convert, the conversion arithmetic does not apply: state what the free costs and judge the other pocket on its own numbers.
Cost one free user from usage
Serving cost from usage data, net of what a free user earns directly. If the only figure is an allocation, stop and get the usage figure first.
Count the flow
This year's new payers from the free base over this year's free base. Put it beside the ratio in the deck so the room sees the difference.
Value one conversion
What a convert pays over the years converts actually stay, checked against customers who were never free.
Compute the break-even rate and the cushion
Then sweep the cost of a free user, because it is the input most often wrong.
Set it beside the paid channel
What a new customer costs through the free against paid acquisition, and the payback in years. Paying for itself and paying for itself this year are different findings.
Choose the lever
If the cushion is thin, meter or cap the free before closing it, and set the conversion and cost levels at which you would act.
What this method cannot tell you
Free tiers that worked are written about, and the ones that quietly cost money are not. The cases above show how each pocket works. They cannot support a success rate for free tiers, and this page does not claim one.
The arithmetic also stops short in three places. It does not price what a free base is worth beyond conversion, which in some cases is the whole return. It carries a conversion to the average tenure of a paying user, although converts from free may stay a different length of time. And it takes the share who would have paid anyway as a stated assumption, because no company has measured it.
Watch these decisions
Short videos built from the same Decision Records as this page.
Questions
What is a good freemium conversion rate?
No benchmark answers it, because published benchmarks are ratios of paying users to all users. The rate that matters is your break-even conversion rate, set by your cost per free user and the value of a conversion. In the worked case in the Free Tier Strategy Pack, a fictional company quotes 5.9 percent, its flow is 1.6 percent and its break-even rate is 0.75 percent.
How do you tell whether a free tier pays for itself?
Divide what one free user costs a year, net of what they earn directly, by what one conversion is worth over the years a convert stays. That is the break-even conversion rate. If the share of the free base that started paying this year is above it, the free pays for itself, and the gap is the cushion.
Is Spotify's conversion rate really 40%?
Spotify's 263 million subscribers over 675 million monthly users is a ratio of two stocks, not a conversion rate. It is the residue of every past year's conversion less every past year's churn, and no filing states what share of the free base started paying in any year.
Should we close a free tier that costs a lot and hardly converts?
Not on those two facts. The cost is usually an allocation and the conversion figure a ratio. Cost a free user from usage, count the flow, compute the break-even rate, and compare what a customer costs through the free with the paid channel. A free tier that does not pay for itself can still be the cheapest customer you buy, and then the lever is the cost of the free.
Is a free trial the same as a free tier?
No. A free trial expires, so its base is a queue and its conversion is the share that pays when the clock runs out. A free tier does not expire, so its base is a stock served indefinitely and its conversion is a flow out of that stock each year.
When does freemium work?
When the share of free users who start paying each year clears the break-even rate, or when another pocket pays: another side of the market, as with Android and Robinhood, or a layer sold on top, as with Fortnite. A free tier judged in the wrong pocket gets the wrong verdict.
Continue learning
Sources & further reading
- Spotify Technology S.A. (Form 6-K) (2024). Q2 2024 Shareholder Letter.
- Spotify Technology S.A. (Form 6-K) (2024). Q4 2023 Shareholder Letter.
- Music Business Worldwide (2025). Spotify posts $1.5bn annual operating profit for 2024, as subscriber base grows to 263m in Q4.
- TechCrunch (2011). All You Need To Know About The NYTimes.com Paywall.
- The New York Times Company (Form 10-K) (2026). Form 10-K for fiscal year 2025.
- Netflix Inc. (Form 8-K) (2023). Q2 2023 Letter to Shareholders.
- Netflix Inc. (2024). Q4 2023 Letter to Shareholders.
- Variety (2023). Netflix Launches Paid Sharing in U.S., Will Start Blocking Users With Unauthorized Passwords.
- Android Authority (2023). Google made its best acquisition nearly 17 years ago: Can you guess what it was?.
- Wikipedia (2025). List of mergers and acquisitions by Alphabet.
- Robinhood Markets, Inc. (Form 8-K) (2025). Robinhood Reports Fourth Quarter and Full Year 2024 Results.
- U.S. Securities and Exchange Commission (2020). SEC Charges Robinhood Financial With Misleading Customers About Revenue Sources and Failing to Satisfy Duty of Best Execution.
- IMD Business School (2022). Alibaba vs. eBay: Competing in the Chinese C2C market.
- INSEAD Knowledge (2022). What the War Between Alibaba and Tencent Says About Strategy.
- Epic Games (2017). Fortnite Battle Royale Goes Free For Everyone On Sept. 26.
- Sacra (2026). Epic Games revenue, valuation & funding.
- Wikipedia (2024). Fortnite Battle Royale.
- Windows Central (2026). Epic Games Store grew from 108M to 295M users, but third-party revenue barely moved.
- Kotaku (2023). Epic v. Google Trial, Day 1 Testimony (Steve Allison).
- Wikipedia (2024). Epic Games Store.
- HubSpot (2024). Upcoming changes to HubSpot's pricing.
- BluLeadz (2024). HubSpot's Evolving Pricing Model: 15 Things You Need to Know.
- CNBC (2020). Quibi officially announces it's shutting down.
- Variety (2021). Roku Acquires Global Rights to 75-Plus Quibi Shows, Will Stream Them for Free.
More to learn
Other foundational guides worth reading.
Pricing Model Change: How to Move to Subscription or Usage Pricing
A pricing model change moves up to four layers at once: the unit you charge for, the shape of the cash, the buyer who signs, and the promise the customer relies on. Name which ones you are moving, size the trough against carrying on unchanged, and run the case again with the volume uplift set to zero.
Pricing StrategyProduct Bundling Strategy: When to Sell Together or Apart
A bundle first hands its discount back to every customer already paying for both products, and earns only on the customers it adds and the extra years bundled customers stay. Match the two customer lists to size the handback, measure the retention gap, and solve for the deepest discount at which selling together still beats selling apart.
Pricing StrategyPrice Increase Strategy: How Much Volume Can a Rise Afford to Lose?
A price rise is decided by two numbers. The share of volume it can afford to lose is arithmetic on the rise and your contribution margin; the share it will lose comes from measuring your own last rise against the trend before it. Raise as far as the gap between them allows, net of what the field discounts away.
Pricing StrategyPrice War Response: When to Match a Rival's Price Cut, or Hold
Matching a rival's cut costs the cut on every unit you sell; holding costs only the volume that leaves. Work out the share of volume you can lose before holding costs more than matching, compare it with how much of your volume the rival can actually reach, and price a guarantee that matches only where customers ask.
M&ASerial Acquisition Strategy: How to Price the Growth You Buy
A serial acquirer's engine is the gap between what the market pays for its earnings and what it pays for somebody else's. Split the plan's growth into the part you will grow and the part you must buy, price each deal as a multiple of the earnings it brings, compare that with buying back your own shares, and state the year the balance sheet stops funding it.
Change & TransformationTurnaround Plan: How to Tell a Real Turnaround from a Cost Program
A turnaround that gives up nothing is a cost program wearing a turnaround's name. The test is what the plan surrenders, what each surrendered dollar has to come back as, and whether that happens inside the time the board, the lenders and the cash allow.
See this framework in the wild.
Follow it across the companies and lenses where it actually shaped the strategy.